< Previous | Contents | Next >
![]()
Grapher is a collection of functions for creating and displaying graphs, networks of nodes and links. Grapher also allows you to associate program behavior with mouse selection of graph nodes. To load this package, type
(FILESLOAD GRAPHER)
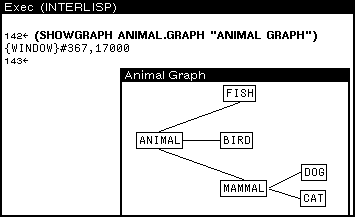
Figure 21-1 shows a simple graph.

Figure 21-1. Simple Graph
In Figure 21-1 there are six nodes (ANIMAL , MAMMAL, DOG, CAT, FISH, and BIRD)
connected by five links. A GRAPH is a record containing several fields. Perhaps the most
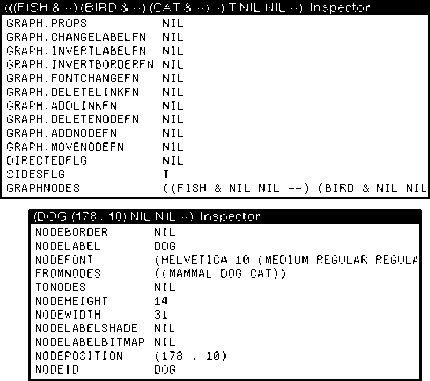
important field is GRAPHNODES —which is itself a list of GRAPHNODE records. Figure 21-2 illustrates these data structures. The window on top contains the fields from the simple
graph. The window on the bottoms an inspection of the node, DOG.

Figure 21-2. Inspecting a Graph and a Node
The GRAPHNODE data structure is described by its text (NODEID ), what goes into it (FROMNODES), what leaves it (TONODES ), and other fields that specify its looks. The basic model of graph building is to create a bunch of nodes, then layout the nodes into a
graph, and finally display the resultant graph. This can be done in a number of ways.
One is to use the function NODECREATE to create the nodes, LAYOUTGRAPH to lay out the nodes, and SHOWGRAPH to display the graph. The primer shows you two simpler ways,
but please see the Library Packages Manual for more information about these other functions. The primer’s first method is to use SHOWGRAPH to display a graph with no nodes or links, then interactively add them. The second is to use the function
LAYOUTSEXPR, which does the appropriate NODECREATES and a LAYOUTGRAPH, with a list.
The function SHOWGRAPH displays graphs and allows you to edit them. The syntax of
SHOWGRAPH is
(SHOWGRAPH graph window lefibuttonfn middlebuttonfn topjustifyflg alloweditflg copybuttoneventfn)
Obviously the graph structure is very complex. Here’s the easiest way to create a graph.
(SETQ MY.GRAPH NIL)
(SHOWGRAPH MY.GRAPH "My Graph" NIL NIL NIL T)

Figure 21-3. My Graph
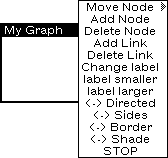
You will be prompted to create a small window as in Figure 21-3. This graph has the title My Graph. Hold down the right mouse button in the window. A menu of graph
editing operations will appear as in Figure 21-4.

Figure 21-4. Menu of Graph Editing Operations
Here’s how to use this menu. The commands in this menu are easy to learn. Experiment with them!
Start by selecting Add Node . Grapher will prompt you for the name of the node (see Figure 21-5.) and then its position.

Figure 21-5. Grapher Prompts for Name of Node to add after Add Node is Chosen from Graph Editing Menu.
Position the node by moving the mouse cursor to the desired location and clicking a mouse button. Figure 21-6 shows the graph with two nodes added using this menu.

Figure 21-6. Two Nodes Added to MY GRAPH Using GraphEditing Menu
Select Add Link from the graph editing menu. The Prompt window will prompt you to select the two nodes to be linked. (See Figure 21-7.) Do this, and the link will be added.


Figure 21-7. Prompt Window Requesting Selection of Two Nodes to Link, and Result
Select Delete Link from the graph editing menu. ThePrompt window will prompt you to select the two nodes that should no longer be linked. (See Figure 21-8.) Do this, and
the link will be deleted.


Figure 21-8. Prompt Window Requesting Selection of Link to Delete, and Result
Select Delete Node from the graph editing menu. The Prompt window will prompt you to select the node to be aeleted. (See Figure 21-9.) Do this, and the node will be deletea.
![]()
Figure 21.-9. Prompt to Delete a Node
Select Delete Node from the graph editng menu. Choose a node pointing to the it with the mouse cursor, and pressing and holding the leff mouse button. When you move the mouse cursor, the node will be dragged along. When the node is at the new position,
release the mouse button to deposit the node.
Typically, a graph is used to display one of your program’s data structures. Here is how that is done.
LAYOUTSEXPR takes a list and returns a GRAPH record. The syntax of the function is
(LAYOUTSEXPR sexpr format boxing font motherd personald famlyd)
For example:
(SETQ ANIMAL.TREE ’(ANIMAL (MAMMAL DOG CAT) BIRD FISH)) (SETQ ANIMAL.GRAPH
(LAYOUTSEXPR ANIMAL.TREE ’HORIZONTAL)) (SHOWGRAPH ANIMAL.GRAPH "My Graph" NIL NIL NIL T)
This is how Figure 21.1 was produced.
The Grapher is designed to be built into other programs. It can call functions when, for example, a mouse button is clicked on a node. The function SHOWGRAPH does this:
(SHOWGRAPH graph window lefibuttonfn middlebuttonfn topjustifyflg alloweditflg copybuttoneventfn)
For example, the third argument to SHOWGRAPH , leftbuttonfn, is a function that is called when the left mouse button is pressed in the graph window. Try this:
(DEFINEQ (My.LEFT.BUTT0N.FUNCTION (THE.GRAPHNODE THE.GRAPH.WINDOW)
(INSPECT THE.GRAPHNODE)))
(SHOWGRAPH FAMILY.GRAPH "Inspectable family" (FUNCTION MY.LEFT.BUTTON.FUNCTION)
NIL NIL T)
In the example above, MY.LEFT.BUTTON.FUNCTION simply calls the inspector. The
function should be written assuming it will be passed a graphnode and the window that holds the graph. Try adding a function of your own.
Some other Library packages make use of the Grapher. (Grapher needs to be loaded with the packages to use these functions.)
• MASTERSCOPE: The Browser package modifies the Masterscope command, . SHOW PATHS, so that its output is displayed as a graph (using Grapher) instead of simply printed.
• GRAPHZOOM: allows a graph to be redisplayed larger or smaller automatically.