< Previous | Contents | Next >
![]()
Masterscope is a tool that allows you to quickly examine the structure of complex
programs. As your programs enlarge, you may forget what variables are global, what functions call other functions, and so forth. Masterscope keeps track of this for you.
To use Masterscope, first load MASTERSCOPE.DFASL and EXPORTS.ALL.
Suppose that JVTO is the name of a file that contains many of the functions involved in a complex system and that LINTRANS is the file containing the remaining functions. The first step is to ask Masterscope to analyze these files. These files must be loaded.
All Masterscope queries and commands begin with a period followed by a space, as in
. ANALYZE FNS ON MSCOPEDEMO
The ANALYZE process takes a while, so the system prints a period on the screen for each function it has analyzed. (See Figure 18-1)

Figure 18-1. Executive Window After Analyzing Files
If you are not quite sure what functions were just analyzed, type the file’s COMS variable (see the File Variables section in Chapter 7) into the Executive Window. The names of
the functions stored on the file will be a part of the value of this variable.
A variety of commands are now possible, all referring to individual functions within the analyzed files. Substantial variation in exact wording is permitted. Some commands
are:
. SHOW PATHS FROM ANY TO ANY
. EDIT WHERE ANY CALLS functionname
. EDIT WHERE ANY USES variablename
. WHO CALLS WHOM
. WHO CALLS functionname
. BY WHOM IS functionname CALLED
. WHO USES variablename AS FIELD
Note that the function is being called to invoke each command. Refer to the IRM for commands not listed here.
Figure 18-2 shows the Executive Window after the commands . WHO CALLS GobbleDump and . WHO DOES JVL inScan CALL.

Figure 18-2. Sample Masterscope Output
18. MASTERSCOPE
When the library package GRAPHER is loaded (to load this package, type (FILESLOAD GRAPHER)), Masterscope’s SHOWPATHS command is modified. The command will be
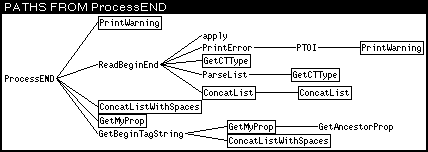
changed to generate a tree structure showi ng how the program’s functions interact instead of a tabular printout into the Executive window. For example, typing:
. SHOW PATHS FROM ProcessEND
produced the display shown in Figure 18-3.

Figure 18-3. SHOW PATHS Display Example
All the functions in the display are part of this analyzed file or a previously analyzed file. Boxed functions indicate that the function name has been duplicated in another place on the display.
Selecting any function name on the display will pretty print the function in a window (see Figure 18-4).


Figure 18-4. Browser Printout Example
Selecting it again with the left mouse button will produce a desription of the function’s role in the overall system (see Figure 18-5).
18. MASTERSCOPE
![]()


Figure 18-5. Browser Description Example